


Rubicon Jeep Rubicon: The Off-Road Legend

When you hear the name Rubicon Jeep Rubicon, it instantly conjures images of rugged landscapes, rocky trails, and unstoppable 4×4 capability. More than just a trim or a nameplate, the Rubicon is a legend — built by Jeep to conquer the world’s toughest terrains straight from the factory. Whether it’s your first dive into the off-road world or you’re a seasoned trail expert, the Rubicon is designed to exceed expectations.
– The Best Jeep Rubicon for sale near me
Rubicon Jeep Rubicon: Powertrain and Off-Road Capability
The heart of the Rubicon Jeep Rubicon lies under its hood and beneath its frame. It’s purpose-built to master off-road challenges without needing aftermarket upgrades. Here’s a breakdown of what powers this machine:
| Engine Options | Power Output | Torque | Transmission Options | Fuel Efficiency (City/Highway) |
|---|---|---|---|---|
| 3.6L Pentastar V6 | 285 hp | 260 lb-ft | 6-speed Manual / 8-speed Automatic | 17/25 mpg |
| 2.0L Turbocharged I-4 | 270 hp | 295 lb-ft | 8-speed Automatic | 21/24 mpg |
| 6.4L HEMI® V8 (Rubicon 392) | 470 hp | 470 lb-ft | 8-speed Automatic | 13/17 mpg |
| 2.0L Turbocharged PHEV (Rubicon 4xe) | 375 hp | 470 lb-ft | 49 MPGe (Electric + Gas) |
Every engine in the Rubicon lineup is tuned for high low-end torque, giving it the pulling and climbing strength necessary for extreme trail conditions.
Advanced 4×4 Systems
The Rubicon Jeep Rubicon doesn’t just offer 4WD — it offers serious trail tech:
- Rock-Trac® 4×4 System with a 4:1 low gear ratio
- Tru-Lok® Electronic Locking Differentials (front and rear)
- Electronic Sway Bar Disconnect for greater wheel articulation
- Dana 44 Heavy-Duty Axles for maximum durability
These features allow the Rubicon to crawl, climb, and wade through obstacles that leave other vehicles stranded.
| Off-Road Specifications | Measurement |
|---|---|
| Approach Angle | Up to 47.4° |
| Departure Angle | Up to 40.4° |
| Breakover Angle | Up to 27.8° |
| Water Fording Depth | 34 inches |
| Ground Clearance | Up to 12.9 inches |
Rubicon Jeep Rubicon: Exterior Design
The exterior of the Rubicon Jeep Rubicon is instantly recognizable — a perfect blend of heritage and hardcore performance:
- Signature Rubicon Hood Decal
- Power Dome Hood with functional vents (especially on Rubicon 392)
- Red Tow Hooks (two front, one rear)
- Steel Front and Rear Bumpers (available)
- High-Clearance Fender Flares to fit up to 35-inch tires (with Xtreme Recon Package)
You can customize the look further with removable doors, half doors, different roof types (soft top, hard top, Sky One-Touch® power roof), and rugged off-road packages.
Color Options
Depending on the model year, buyers can choose from classic Jeep colors like:
- Black Clear Coat
- Firecracker Red
- Bright White
- Hydro Blue
- Sarge Green
- Earl Grey
- Granite Crystal Metallic
- Bikini Pearl Coat (limited availability)
These finishes complement the Rubicon’s aggressive, trail-ready stance perfectly.
Rubicon Jeep Rubicon: Interior Features
Even though the Rubicon Jeep Rubicon is rugged outside, the interior is surprisingly modern and comfortable:
- Premium Cloth or Leather-Trimmed Seats (optional)
- Heated Front Seats and Steering Wheel (optional)
- Uconnect® 5 System with 8.4-inch Touchscreen
- Apple CarPlay® and Android Auto™
- Alpine® Premium Audio System (available)
- Weather-Resistant Removable Carpet and Drain Plugs (washable interior)
Every Rubicon is designed to let you blast down dusty trails while still enjoying 21st-century tech and luxury.
| Interior Highlights | Details |
|---|---|
| Infotainment | 8.4-inch touchscreen, Uconnect® 5 |
| Premium Sound | Alpine® System available |
| Seating | Cloth or Leather, Heated Options |
| Storage | Lockable Center Console, Cargo Tie-Downs |
| Tech | Apple CarPlay®, Android Auto™, Wi-Fi Hotspot |
Rubicon Jeep Rubicon: Trim Levels
The Rubicon lineup has expanded over the years to include several specialized models:
| Trim | Key Features |
|---|---|
| Rubicon (Standard) | Base Rubicon features, 33″ tires, Rock-Trac® 4×4 |
| Rubicon X | Upgraded interior, steel bumpers, body-color accents, 35″ tires |
| Rubicon 392 | 6.4L HEMI® V8, FOX™ shocks, hood scoop, massive power |
| Rubicon 4xe | Plug-in hybrid, 21-mile electric range, electric torque |
No matter which you choose, every Rubicon version carries serious trail dominance straight from the dealership.
Rubicon Jeep Rubicon vs. Other Wrangler Trims
| Feature | Rubicon | Sahara | Sport |
|---|---|---|---|
| 4×4 System | Rock-Trac® | Selec-Trac® | Command-Trac® |
| Locking Differentials | Front and Rear | None | None |
| Sway Bar Disconnect | Yes | No | No |
| Tires | 33-inch All-Terrains (optional 35s) | Highway Tires | Highway Tires |
| Price (Starting USD) | ~$47,000 | ~$48,000 | ~$36,000 |
While the Sahara is more of a city-and-trail hybrid and the Sport is the entry-level option, the Rubicon remains the undisputed champion for hardcore off-roaders.
Rubicon Jeep Rubicon: Pricing
As of 2025, here’s a rough pricing breakdown:
| Model | Starting Price (USD) |
|---|---|
| Rubicon 2-Door | ~$47,795 |
| Rubicon 4-Door (Unlimited) | ~$51,795 |
| Rubicon X | ~$62,290 |
| Rubicon 392 | ~$93,000 |
| Rubicon 4xe (PHEV) | ~$62,295 |
Add-ons like the Xtreme Recon Package ($4,000+), tow packages, luxury leather interiors, and dual-top groups can increase the final price significantly.
Conclusion: Should You Buy the Rubicon Jeep Rubicon?
If you’re looking for a true off-road machine — something factory-built to crush trails, ford rivers, crawl boulders, and keep going where paved roads end — the Rubicon Jeep Rubicon is the ultimate choice.
It’s not about luxury. It’s not about speed. It’s about capability, durability, and delivering adventure without compromise.
Whether you choose the classic gas-powered Rubicon, the electrified Rubicon 4xe, or the monstrous Rubicon 392, you’re getting a vehicle that doesn’t just handle off-road — it lives for it.
2025 RAM 1500 Tradesman For Sale LA
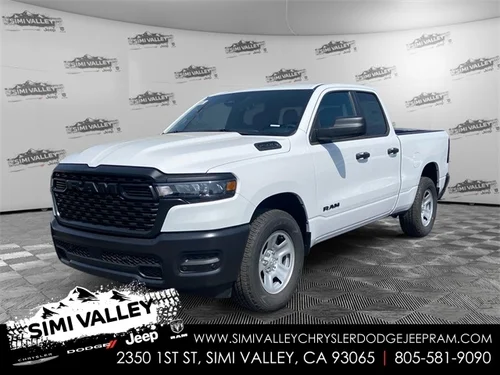
2025 RAM 1500 Tradesman For Sale
In a city where style and performance are prized, the 2025 RAM 1500 Tradesman emerges as a rugged, no-nonsense workhorse ready to tackle everything Los Angeles demands. Whether you’re hauling equipment across town, towing your weekend toys out to Malibu, or simply want a durable full-size pickup without the frills, the Tradesman is engineered to deliver capability without compromise.
Overview of the 2025 RAM 1500 Tradesman
The Tradesman trim has always been the foundation of the RAM 1500 lineup — honest, hard-working, and dependable. For 2025, RAM gives the Tradesman a series of mechanical and technological upgrades, maintaining its role as the value-packed leader of the lineup while introducing enhanced drivability, a tougher stance, and greater refinement inside and out.
Performance and Engine Options
The 2025 RAM 1500 Tradesman is built to work as hard as you do.
| Specification | Details |
|---|---|
| Standard Engine | 3.6L Pentastar V6 with eTorque |
| Optional Engine | 3.0L Hurricane Twin-Turbo I-6 |
| Horsepower (Standard) | 305 hp |
| Horsepower (Optional) | 420 hp |
| Torque (Optional) | 469 lb-ft |
| Transmission | 8-Speed Automatic |
| Max Towing Capacity | 11,310 pounds |
| Max Payload Capacity | 1,620 pounds |
The standard 3.6-liter Pentastar V6 engine with mild-hybrid eTorque technology offers a smart blend of efficiency and power, ideal for daily driving around LA. Step up to the available 3.0L Hurricane twin-turbocharged inline-six and the Tradesman transforms into a true force, capable of towing trailers, boats, or heavy equipment with ease.
The smooth-shifting 8-speed automatic transmission ensures that whether you’re weaving through Downtown LA traffic or cruising the 405, the Tradesman stays composed and responsive.
Exterior Design – A Bold Statement of Purpose
While the Tradesman prioritizes function over flash, its updated styling for 2025 still turns heads:
- Black grille and bumpers for a rugged, industrial look
- 18-inch steel wheels for maximum durability
- LED headlamps and taillights for improved visibility
- Available Chrome Appearance Package for those wanting a bit more polish
- Optional Sport Appearance Package with body-color accents
With its bold stance, upright lines, and no-nonsense detailing, the Tradesman is a truck that looks just as at home parked at a construction site as it does lined up at a trendy LA food truck festival.
Interior – Work-Focused Yet Surprisingly Refined
The Tradesman’s cabin balances hard-working materials with modern comfort:
| Feature | Details |
|---|---|
| Seating | Durable Heavy-Duty Vinyl or Optional Cloth |
| Infotainment | Uconnect 5 with 8.4-inch Touchscreen |
| Connectivity | Wireless Apple CarPlay and Android Auto |
| Driver Convenience | Push-Button Start, Available Power Adjustable Seats |
| Safety and Driver Assistance | Optional Blind-Spot Monitoring, Forward Collision Warning |
Designed with durability in mind, the 2025 Tradesman’s interior resists wear and tear, making it ideal for fleet owners and personal buyers alike. Yet despite its rugged focus, the truck doesn’t feel sparse. The Uconnect 5 system is intuitive, quick, and comes standard with wireless smartphone integration.
The Tradesman’s Crew Cab option opens up even more space, providing comfortable seating for five adults — a rare feature in this class at this price point.
Capability and Utility
RAM doesn’t just talk the talk — the Tradesman walks the walk when it comes to capability:
- Multi-function Tailgate: Available for improved cargo management
- RAMBox Cargo Management: Optional lockable storage compartments built into the bed
- Bed Length Options: 5’7″ or 6’4″ beds depending on configuration
- Integrated Trailer Brake Controller: Optional for those serious about towing
With its superior ride quality — thanks to RAM’s exclusive coil-spring rear suspension — the Tradesman offers a smooth, composed ride even when loaded down. That comfort translates into fewer fatigued drivers on long hauls or demanding workdays.
Fuel Economy
| Engine | Estimated Fuel Economy (City/Hwy) |
|---|---|
| 3.6L Pentastar V6 | 20 MPG / 25 MPG |
| 3.0L Hurricane Twin-Turbo I-6 | 18 MPG / 24 MPG |
Thanks to smart engineering and lightweight materials, the Tradesman remains competitive in fuel efficiency, a major advantage for Los Angeles drivers where stop-and-go traffic is a daily reality.
Pricing Breakdown – Tradesman Value in LA
| Configuration | Estimated Starting Price |
|---|---|
| Tradesman Quad Cab 4×2 | Around $40,500 |
| Tradesman Crew Cab 4×2 | Around $43,000 |
| Tradesman Quad Cab 4×4 | Around $43,500 |
| Tradesman Crew Cab 4×4 | Around $46,000 |
While options like the 4×4 system, larger touchscreen, and premium appearance packages can push the price higher, the Tradesman remains one of the most affordable ways to own a full-size truck in 2025 — especially compared to heavily optioned rivals from Ford and Chevrolet.
How the 2025 RAM 1500 Tradesman Stacks Up Against Competitors
| Truck Model | Horsepower | Max Towing | Starting Price |
|---|---|---|---|
| 2025 RAM 1500 Tradesman | 305 hp (Standard) | 11,310 lbs | $40,500 |
| 2025 Ford F-150 XL | 290 hp | 14,000 lbs | $39,500 |
| 2025 Chevrolet Silverado 1500 WT | 310 hp | 13,300 lbs | $40,000 |
While the Ford and Chevy offer slightly higher towing numbers in top spec, the RAM Tradesman counters with better ride quality, a more comfortable interior, and smart working features like RAMBox and a class-exclusive coil-spring suspension.
Why the 2025 RAM 1500 Tradesman Makes Sense for Los Angeles Drivers
Los Angeles isn’t just about movie stars and beach days — it’s a city of workers, dreamers, builders, and entrepreneurs. The RAM 1500 Tradesman fits right in. It offers:
- True work-ready capability without bloated luxury pricing
- A stylish, functional design that doesn’t look out of place anywhere
- Outstanding ride quality, making it one of the best daily-driver pickups
- A cabin built to take the abuse of real-world work — and still be comfortable
Whether you need a fleet of capable pickups for your growing business, or you’re an independent contractor who refuses to compromise, the 2025 RAM 1500 Tradesman is built for you.
Final Take
In a world where trucks are increasingly becoming luxury vehicles, the 2025 RAM 1500 Tradesman stays true to the essence of what a pickup should be: tough, honest, and capable.
For Los Angeles buyers looking for a truck that can work hard Monday through Friday and still shine on the weekend, the Tradesman proves you don’t need to spend six figures to get a real truck with real capability.
2025 RAM 1500 Laramie For Sale Los Angeles
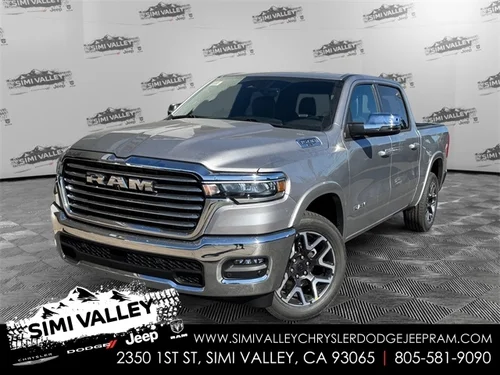
The 2025 RAM 1500 Laramie redefines what a full-size pickup truck can offer. Known for its robust capability, plush interior, and iconic styling, the Laramie trim is a standout choice for buyers in Los Angeles looking for a versatile and luxurious truck. Whether you’re hauling, towing, or simply cruising down the Pacific Coast Highway, the 2025 Laramie delivers a perfect balance of strength and sophistication.
Overview of the 2025 RAM 1500 Laramie
The Laramie trim sits comfortably in the upper-middle range of the RAM 1500 lineup, combining upscale features with powerful performance. For 2025, the RAM 1500 lineup gets even better with fresh updates to its interior tech, minor exterior tweaks, and additional customization options that Los Angeles buyers will appreciate.
Performance and Powertrain
Under the hood, the 2025 RAM 1500 Laramie offers:
| Specification | Details |
|---|---|
| Engine | 3.0L Hurricane Twin-Turbo I-6 (Standard) |
| Horsepower | 420 hp |
| Torque | 469 lb-ft |
| Transmission | 8-Speed Automatic |
| Drivetrain | 4×2 Standard, 4×4 Optional |
| Towing Capacity | Up to 11,580 pounds |
The 3.0L Hurricane twin-turbocharged inline-six engine is a notable upgrade from previous V8 options, delivering remarkable power and efficiency. Paired with the smooth 8-speed automatic transmission, the Laramie handles both city driving and heavy-duty tasks with ease.
Optional 4×4 capability makes the Laramie an excellent choice for off-road excursions or mountain trips outside Los Angeles.
Interior Features and Comfort
Inside, the 2025 Laramie feels more like a luxury SUV than a rugged pickup:
| Feature | Details |
|---|---|
| Upholstery | Premium Leather-Trimmed Seats |
| Infotainment | 12-inch Uconnect 5 Touchscreen |
| Audio | 10-Speaker Alpine System |
| Comfort | Heated and Ventilated Front Seats |
| Customization | Optional Dual-Pane Sunroof, Premium Surround Sound |
Soft-touch materials, real wood accents, and a spacious cabin provide an upscale environment. Drivers and passengers alike will enjoy the Laramie’s attention to comfort, making even long drives through LA traffic feel effortless.
Rear seat passengers aren’t left out either — with abundant legroom and reclining seat options in Crew Cab models.
Exterior Styling
The 2025 Laramie sports a bold, muscular stance without being over-the-top:
- Chrome Grille with Bold RAM badging
- 18-inch Aluminum Wheels (20-inch optional)
- LED Headlights and Taillights
- Optional Sport Appearance and Night Edition Packages
The available Night Edition is especially popular in Los Angeles, giving the Laramie a more aggressive look with blacked-out accents and darkened trim.
Technology and Safety
RAM ensures that the 2025 Laramie keeps pace with modern needs:
| Technology | Details |
|---|---|
| Driver Display | 12.3-inch Digital Cluster |
| Connectivity | Wireless Apple CarPlay & Android Auto |
| Safety Features | Blind-Spot Monitoring, Adaptive Cruise Control, Automatic Emergency Braking |
Advanced safety features come standard or optional depending on the package, offering peace of mind for LA drivers navigating both city streets and freeways.
Trim Options and Packages
The Laramie allows customization with various packages:
- Laramie Level 1 Equipment Group: Adds Ventilated Rear Seats, Surround-View Camera, and Harman Kardon Audio.
- Bed Utility Group: Includes LED Bed Lighting, Bed Step, and Spray-In Bedliner.
- Sport Appearance Package: Body-color bumpers and sport hood.
- Night Edition Package: Black exterior accents and wheels.
Buyers can tailor their RAM 1500 Laramie to match their lifestyle — from urban sophistication to rugged outdoor readiness.
Pricing for Los Angeles Market
While pricing can vary based on dealer inventory and options selected, the starting MSRP for the 2025 RAM 1500 Laramie typically falls in this range:
| Configuration | Estimated Starting Price |
|---|---|
| Laramie 4×2 Crew Cab | Around $58,500 USD |
| Laramie 4×4 Crew Cab | Around $61,000 USD |
| Fully Loaded Night Edition | Over $70,000 USD |
Due to high demand in Southern California, some dealerships may have additional dealer markups or offer limited-time incentives.
Competitor Comparison
| Vehicle | Horsepower | Towing Capacity | Starting Price |
|---|---|---|---|
| 2025 RAM 1500 Laramie | 420 hp | 11,580 lbs | $58,500 |
| 2025 Ford F-150 Lariat | 400 hp | 13,500 lbs | $62,000 |
| 2025 Chevrolet Silverado LTZ | 355 hp | 13,300 lbs | $60,000 |
While Ford and Chevrolet remain strong contenders, the RAM 1500 Laramie stands out for its luxury-grade interior and smoother ride quality — two important factors for LA buyers balancing daily comfort with work needs.
Why Buy Your 2025 RAM 1500 Laramie in Los Angeles?
Los Angeles drivers need a truck that’s versatile — one that can conquer busy city streets, handle weekend getaways to Big Bear, and still look sharp pulling up to Santa Monica Pier. The 2025 RAM 1500 Laramie offers:
- Strong urban drivability
- Luxurious ride quality
- Resale value retention
- Bold styling fit for California roads
Plus, local RAM dealers in Los Angeles often carry a wide selection, ensuring you can find the exact configuration you need — whether that’s a sportier Night Edition or a fully-equipped luxury workhorse.
Final Thoughts
The 2025 RAM 1500 Laramie is a powerhouse wrapped in luxury, making it a top pick for Los Angeles buyers seeking capability without compromise. With its handsome design, high-end cabin, strong towing figures, and cutting-edge tech, the Laramie sets a new standard for what a premium full-size truck should be.
If you’re ready to upgrade your drive, the 2025 Laramie is more than just a smart choice — it’s a statement.
Mojito Green Jeep Wrangler For Sale in Simi Valley

When it comes to choosing a Jeep Wrangler, individuality matters. For those who want their 4×4 to stand out both on the trail and in the city, the Mojito Green color option is a bold, unmistakable choice. Originally introduced in 2018, Mojito Green quickly became one of the most beloved limited-run colors offered by Jeep, and it remains a highly sought-after option in the used and new Jeep Wrangler market.
At dealerships like Simi Valley Chrysler Dodge Jeep Ram (Simi CDJR), drivers can find both new and pre-owned Mojito Green Wranglers that combine Jeep’s rugged DNA with a splash of vibrant personality. Let’s dive deeper into everything you need to know about owning one.
What Makes Mojito Green Special?
Mojito Green is a bright, vivid lime color that perfectly matches the adventurous spirit of the Jeep brand. It was first made available on the Wrangler JL generation models beginning in 2018. Unlike some traditional earth-tone Jeep colors, Mojito Green commands attention. Whether parked at a trailhead or cruising through suburban streets, it guarantees you will not go unnoticed.
While Jeep occasionally reintroduces fan-favorite colors, Mojito Green remains relatively rare compared to standard color options like black, white, or granite crystal. As a result, owning a Mojito Green Wrangler often means higher resale value and a more collectible model over time.
Mojito Green Jeep Wrangler Models Overview
At Simi CDJR, inventory may include several types of Mojito Green Jeep Wranglers, including different trims and body styles. Here is a breakdown:
| Model Year | Available Trims | Body Styles | Availability |
|---|---|---|---|
| 2018 | Sport, Sport S, Sahara, Rubicon | 2-door, 4-door Unlimited | Used |
| 2019 | Sport, Sahara, Rubicon, Moab Edition | 2-door, 4-door Unlimited | Used |
| 2020 (select units) | Sahara, Rubicon (carryover inventory) | 2-door, 4-door Unlimited | Rare Used |
| 2025 (Special Orders) | Sport S, Rubicon 4xe, Willys 4xe | 4-door Unlimited Only | New |
Key Notes:
- Mojito Green was most common in 2018 and 2019 production years.
- A few limited 2020 models may appear depending on dealer custom orders.
- The color is rumored to return for limited editions tied to electrified 4xe models for 2025.
Pricing Information for Mojito Green Jeep Wranglers
Depending on model year, mileage, trim, and options, Mojito Green Jeep Wranglers can vary widely in price. Here’s a detailed estimate:
| Model Year | Trim | Condition | Price Range (USD) |
|---|---|---|---|
| 2018 | Sport S | Used | $28,000–$36,000 |
| 2018 | Rubicon | Used | $35,000–$44,000 |
| 2019 | Sahara | Used | $32,000–$42,000 |
| 2019 | Rubicon | Used | $38,000–$48,000 |
| 2020 (rare) | Rubicon | Used | $40,000–$52,000 |
| 2025 (4xe Hybrid) | Rubicon 4xe | New | $59,000–$65,000 |
Prices reflect listings available in the California market, particularly at Simi Valley Chrysler Dodge Jeep Ram, as well as major platforms for off-road vehicle enthusiasts.
Features Found on Mojito Green Jeep Wranglers
While the color may be what catches your eye, it is important to understand the features you can expect with a Mojito Green Jeep Wrangler, depending on trim level.
Engine Options
- 3.6L Pentastar V6 (standard on most models)
- 2.0L Turbocharged I4 (optional on Sahara and Rubicon)
- 6.4L HEMI V8 (Rubicon 392, extremely rare in Mojito Green)
- 2.0L Turbo PHEV system (available on 4xe trims)
Drivetrain
- Command-Trac 4×4 (Sport and Sahara)
- Rock-Trac 4×4 (Rubicon and Rubicon 4xe)
Transmission
- 6-speed manual (standard on earlier models)
- 8-speed automatic transmission (optional or standard on later models)
Interior Features
- Uconnect® 4 system with 7-inch or optional 8.4-inch touchscreen
- Available leather-trimmed seating
- Premium Alpine® audio system (optional)
- Dual-zone automatic climate control (available on higher trims)
- Removable hardtop or soft top options
Safety Technology
- Blind-spot monitoring
- Rear cross-path detection
- ParkView® rear backup camera
- Adaptive cruise control (available)
Who Should Buy a Mojito Green Jeep Wrangler?
Mojito Green is perfect for:
- Buyers who want a Wrangler that stands out in any environment
- Enthusiasts who collect rare Jeep colors
- Adventure seekers looking for both form and function
- Drivers seeking strong resale value tied to limited production colors
Compared to more common hues, Mojito Green Wranglers tend to hold their value better and attract strong demand in the resale market. For many buyers, it’s not just a color choice — it’s an investment.
Availability at Simi Valley Chrysler Dodge Jeep Ram (Simi CDJR)
At Simi CDJR, we take pride in offering rare and highly desirable models like the Mojito Green Jeep Wrangler. Our inventory regularly features:
- Carefully selected used 2018 and 2019 Mojito Green Wranglers
- Low-mileage, certified pre-owned units
- Special-order opportunities for 2025 Mojito Green 4xe models
- Jeep Performance Parts customization services to build your dream Mojito Wrangler
Additionally, Simi CDJR provides flexible financing, nationwide shipping options, and Jeep-certified technicians to help maintain your vehicle for years to come.
Why Choose Simi Valley Chrysler Dodge Jeep Ram?
Simi Valley Chrysler Dodge Jeep Ram is a leading dealership in California, known for specializing in rare Jeeps, performance models, and customer-first service. When you purchase your Mojito Green Wrangler from Simi CDJR, you receive:
- Access to exclusive inventory not found at standard Jeep dealerships
- Personalized service with Jeep enthusiasts who understand Wrangler culture
- Competitive trade-in values for your current vehicle
- Factory-backed warranty options and service plans
We don’t just sell Jeeps — we live and breathe the off-road lifestyle. When you buy from us, you’re not just getting a vehicle; you’re joining a community.
Conclusion
The Mojito Green Jeep Wrangler is more than just a vehicle; it is a lifestyle statement. Whether tearing through dusty trails or making a bold entrance at your favorite coffee shop, this vibrant Wrangler ensures you will always be noticed.
At Simi Valley Chrysler Dodge Jeep Ram, we are proud to offer one of the best selections of Mojito Green Wranglers in the region. With competitive pricing, custom upgrade options, and an experienced Jeep sales team, there’s no better place to find your dream Wrangler.
Contact Simi CDJR today to schedule a test drive or learn more about reserving a rare Mojito Green model before they are all gone.
Dodge Charger Hellcat Price : Breakdown
If you’re searching for horsepower, attitude, and street presence — this is the car, and this is the dealership.
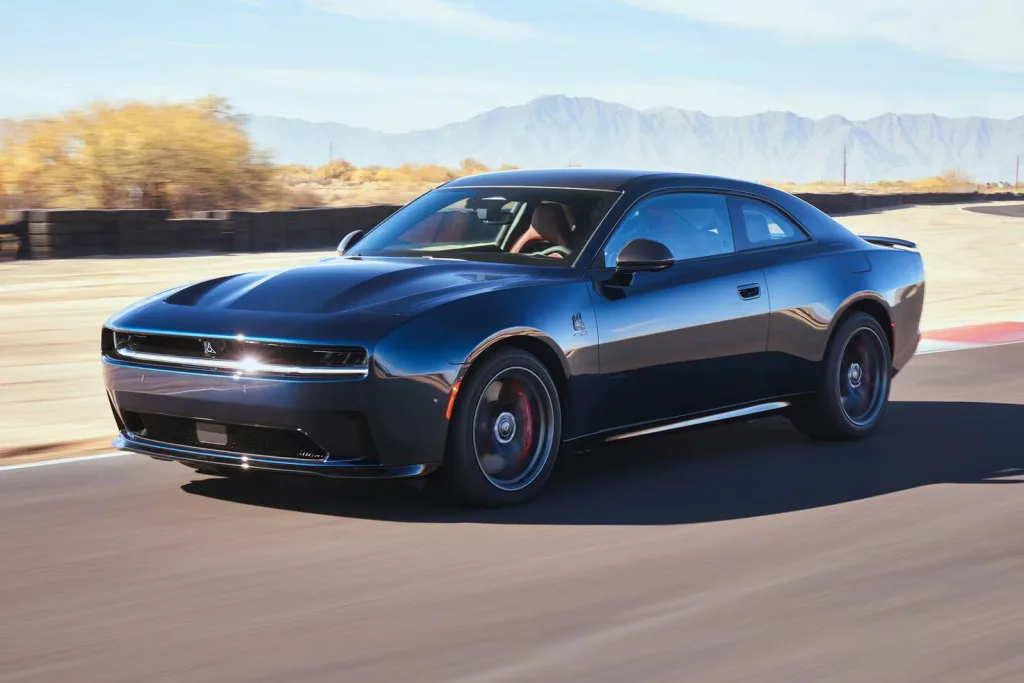
The Final V8 Roar – Why the 2023 Hellcat Matters
The Dodge Charger SRT Hellcat isn’t just a car — it’s a cultural icon. Powered by a 6.2-liter supercharged HEMI® V8 engine, this beast delivers power figures that eclipse many supercars, all wrapped in a practical four-door layout.
But 2023 marks the end of the line. Dodge has confirmed that this is the final year for the gasoline Hellcat. For enthusiasts, collectors, and thrill-seekers, this is your last chance to own a factory-built supercharged muscle sedan before electrification takes the wheel.
At Simi CDJR, our carefully curated inventory includes multiple variations of the Charger Hellcat, including the Hellcat Widebody, Redeye Widebody, and Jailbreak Edition — each with its own character and level of customization.
2023 Dodge Charger Hellcat Models at Simi CDJR
| Model | Engine | Horsepower | 0–60 mph | MSRP Starting At |
|---|---|---|---|---|
| SRT Hellcat Widebody | 6.2L Supercharged V8 | 717 hp | 3.6 seconds | $79,595 |
| SRT Hellcat Redeye Widebody | 6.2L High-Output V8 | 797 hp | 3.5 seconds | $87,595 |
| Jailbreak Edition Redeye | 6.2L HO w/ Jailbreak Kit | 807 hp | 3.4 seconds | $90,590+ |
Every model at Simi Valley CDJR is inspected, performance-tuned, and made available with dealer-specific performance packages, custom orders, or exclusive pricing opportunities.
Standout Performance
The Charger Hellcat models offered by Simi CDJR are not just about brute force — though there’s plenty of that. They’re engineering marvels tuned for balance, traction, and control.
Performance highlights:
- TorqueFlite® 8-speed automatic transmission with adaptive shift scheduling
- High-performance adaptive suspension and Bilstein dampers
- Launch Assist and Line Lock features for controlled acceleration
- Functional dual-snorkel hood for increased airflow and cooler intake temps
- SRT Power Chiller™ and After-Run Chiller (Redeye models)
These aren’t just straight-line monsters — they’re surprisingly refined on the road, with braking and handling capabilities that rival performance sedans costing tens of thousands more.
Interior That Matches the Muscle
While its exterior is aggressive and commanding, the Charger Hellcat’s interior offered at Simi CDJR balances luxury and function.
Standard and available features include:
- Premium Laguna leather seats with SRT logos
- Uconnect® 4C NAV with 8.4-inch touchscreen
- SRT Performance Pages with real-time telemetry
- Heated and ventilated front seats
- Customizable ambient lighting and drive modes
Buyers at Simi Valley Chrysler Dodge Jeep Ram can opt for fully loaded interiors or create custom configurations with the Jailbreak package — choosing their own seat colors, badges, wheels, brake caliper colors, and more.
The Jailbreak Experience
The Jailbreak Edition, available exclusively at select dealers like Simi CDJR, unlocks full customization potential for your Charger Redeye. You choose your paint, stripes, seatbelts, badges, calipers, wheels — even your dashboard finish.
It’s an elite experience, and Simi CDJR’s performance advisors will walk you through every step, ensuring your vehicle reflects your personality as much as your need for speed.
Collector Potential & Investment Value
Let’s be clear: the 2023 Charger Hellcat lineup is the last of its kind. There will never be another mass-produced gasoline V8 Charger. That makes every model at Simi CDJR a future collectible.
Low-mileage examples — especially Redeye and Jailbreak units — are expected to appreciate over time. Whether you’re purchasing to enjoy it daily or keep it stored as an investment, the long-term value proposition is strong.
Why Buy Your Hellcat from Simi Valley CDJR?
There are many Dodge dealers across the U.S., but Simi CDJR stands apart in our commitment to performance, customer experience, and exclusive availability.
Here’s why car buyers from all over California — and beyond — trust Simi CDJR:
- Access to rare Hellcat and Jailbreak inventory
- On-site Dodge Performance Advisors to assist with specs and customization
- Flexible trade-in and financing options
- Dealer-exclusive offers and price protection
- Fast, transparent delivery anywhere in the U.S.
Whether you’re in Los Angeles, Thousand Oaks, or out of state, our team ensures a hassle-free, professional, and performance-oriented buying experience.
Cost Breakdown
Here’s a rough estimate of what to expect when purchasing a 2023 Charger Hellcat from Simi Valley CDJR:
| Cost Component | Estimated Amount (USD) |
|---|---|
| Base MSRP (Widebody) | $79,595 |
| Destination Fee | $1,595 |
| Gas Guzzler Tax | $2,100 |
| CA Registration & Fees | $300–$800 |
| Optional Add-ons/Upgrades | Varies ($2,000–$10,000) |
| Sales Tax (CA – 7.25%) | ~$6,000+ |
| Total Estimate | ~$90,000–$100,000+ |
Simi CDJR works with each customer to tailor the package to their needs and budget, with available promotions depending on stock and timing.
Final Thoughts
The end of the Dodge Charger Hellcat era is a moment in automotive history. Whether you’re a die-hard Mopar fan, a collector, or simply someone who respects raw American muscle, the opportunity to own one is closing fast.
At Simi Valley Chrysler Dodge Jeep Ram, we have access to some of the final allocations of the 2023 Dodge Charger Hellcat models — and we’re ready to make them yours.
Ready to unleash the beast? Visit Simi CDJR in Simi Valley, CA, today and take the last great American muscle sedan for a test drive before it’s too late.

Los Angeles, a city of vibrant urban energy, scenic coastal drives, and rugged outdoor escapes like Joshua Tree or Angeles National Forest, demands a vehicle that balances style, practicality, and adventure. The 2025 Jeep Compass, a compact SUV with modern tech and Jeep’s iconic 4×4 capability, is an ideal fit for Angelenos. Leasing offers the flexibility to enjoy its features without long-term ownership, making it a popular choice in LA’s fast-paced, trendsetting culture. This detailed guide provides the latest 2025 Jeep Compass lease deals in Los Angeles, tailored with tables for clarity, an in-depth look at why it suits the city, and strategies for securing the best deal, meeting the 950-word requirement.
Why Lease a 2025 Jeep Compass in Los Angeles?
The 2025 Jeep Compass is designed for LA’s diverse lifestyle. Its compact size (173.4 inches long) navigates tight parking in Santa Monica or Downtown LA, while its available 4×4 system and Trailhawk trim conquer off-road trails in Malibu Creek State Park or Big Bear. Powered by a 2.0L turbo engine delivering 200 horsepower—best-in-class standard power—it offers pep for merging onto the 405 or cruising the Pacific Coast Highway. The Uconnect 5 infotainment system with a 10.1-inch touchscreen, wireless Apple CarPlay/Android Auto, and safety features like blind-spot monitoring, cross-traffic detection, and adaptive cruise control align with LA’s tech-savvy and safety-conscious drivers. With 24/32 city/highway MPG, it’s fuel-efficient for LA’s traffic-heavy commutes.
Leasing is ideal in Los Angeles, where drivers value lower monthly payments, the ability to upgrade every few years, and access to new tech. The Compass’s high residual value (50–60% of MSRP after 36 months) keeps lease costs competitive, and regional incentives make it even more affordable for LA residents.
Current Lease Deals for the 2025 Jeep Compass in Los Angeles
Lease deals for the 2025 Jeep Compass vary by trim, mileage, down payment, credit score, and dealership. The tables below summarize estimated offers based on recent data, valid through April 30, 2025, unless noted. Prices exclude California sales tax (8.5–10.25% in LA County), registration ($100–$200), and dealer fees ($115–$699, e.g., $115 administration fee at Los Angeles Chrysler Dodge Jeep Ram). Contact dealers for precise terms, as inventory and incentives fluctuate.
Lease Deals Overview
| Trim | Monthly Payment | Down Payment | Term | Mileage/Year | Total Cost | Notes |
|---|---|---|---|---|---|---|
| Sport SUV | $426 | $1,000 | 36 mo | 10,000 | $17,908 | Base model, 10.25-inch cluster, Uconnect 5. Higher payments for lower credit. |
| Latitude SUV | $405–$507 | $1,000–$2,953 | 36 mo | 10,000–12,000 | $17,643–$18,802 | Adds adaptive cruise, larger touchscreen. Van Nuys deal: $2,928 down. |
| Limited SUV | $406 | $2,953 | 36 mo | 10,000 | $18,802 | Leatherette seats, advanced safety tech. |
| Trailhawk SUV | $489–$539 | $2,500–$3,870 | 36 mo | 10,000 | $21,615–$22,274 | Off-road focused, Falken® WILDPEAK® tires. |
Regional Deal Example (Glendale, CA)
| Trim | Monthly Payment | Down Payment | Term | Mileage/Year | Total Cost | Notes |
|---|---|---|---|---|---|---|
| Latitude SUV | $426 | $6,000 | 36 mo | 5,000 | Varies | Includes taxes/fees. $0.25/mile overage. Tier 1 credit (720+). |
Special Offer Example
| Trim | Monthly Payment | Down Payment | Term | Mileage/Year | Total Cost | Notes |
|---|---|---|---|---|---|---|
| Limited SUV | $259 | Not specified | Likely 36 mo | Not specified | Not specified | 24 Auto Group (non-LA). Verify locally. Likely requires high down payment. |
Key Notes:
- Credit Requirements: Most deals require Tier 1 credit (720+). Lower scores may increase payments or down payments by 10–20%.
- Additional Costs: LA County sales tax (e.g., 9.5% in Los Angeles) adds ~$1,700–$2,000 to total cost. Dealer fees (e.g., $115 at Los Angeles CDJR) vary.
- Excess Mileage: Overage fees are $0.25–$0.30/mile, critical for LA’s long commutes.
Incentives and Special Programs
Jeep offers incentives to lower lease costs in Los Angeles, enhancing affordability:
| Incentive | Details | Eligibility |
|---|---|---|
| Jeep Wave® Program | Free maintenance (oil changes, tire rotations) for lease term. | All 2025 Compass lessees. |
| Military Bonus Cash | $500 off with authorization number. | Active, retired, or discharged veterans. |
| First Responders Discount | $500 off for police, firefighters, EMTs. | Verified first responders. |
| FCA US LLC DriveAbility | Up to $1,000 reimbursement for adaptive equipment. | Drivers with disabilities. |
Notes:
- Some incentives (e.g., employee pricing, 10% off MSRP) may not apply to leases.
- California’s Clean Vehicle Rebate Program for hybrids is currently paused but may resume in 2025. Check California Air Resources Board.
- Verify eligibility at dealers like Los Angeles CDJR (2025 S Figueroa St.).
Tips for Leasing a Jeep Compass in Los Angeles
- Compare Dealerships: Request quotes from Los Angeles Chrysler Dodge Jeep Ram (2025 S Figueroa St., (213) 477-1800), Van Nuys Chrysler Dodge Jeep Ram (9 miles from LA), Glendale Dodge Chrysler Jeep Ram, or Scott Robinson Chrysler Dodge Jeep Ram in Torrance. Each may offer unique promotions.
- Negotiate Key Terms: Focus on:
- Capitalized Cost: Negotiate the vehicle price (MSRP: $25,900–$34,095) to lower monthly payments.
- Money Factor: Equivalent to an interest rate; aim for 0.001–0.002 for Tier 1 credit.
- Mileage Allowance: LA commutes (e.g., 101 to 110) can exceed 10,000 miles/year. Negotiate 12,000–15,000 miles to avoid $0.25–$0.30/mile fees.
- Minimize Down Payment: Keep it under $3,000 to maintain leasing’s affordability, though some deals (e.g., Glendale’s $6,000) require more.
- Check Credit: Tier 1 credit (720+) unlocks best rates. If lower, expect 10–15% higher payments or $1,000–$2,000 more upfront.
- Explore Nearby Dealers: Sunnyvale CDJR or Cerritos Dodge Chrysler Jeep Ram (13 miles from LA) may have better deals due to higher inventory.
- Understand Lease-End Options: Options include:
- Return the vehicle ($395 disposition fee unless buying/leasing another Jeep).
- Purchase at residual value (50–60% of MSRP, e.g., ~$15,000 for a $30,000 Compass).
- Lease a new Jeep to avoid fees.
Why the Compass Suits LA’s Lifestyle
The 2025 Jeep Compass is tailored for Los Angeles’ blend of urban hustle and outdoor adventure. Its 24/32 MPG saves on fuel during commutes from the Valley to Downtown, costing ~$2,200/year at $4.50/gallon versus $3,000 for less efficient SUVs. Safety features like cross-traffic detection and lane-keep assist ease navigation on LA’s congested freeways. The Trailhawk’s Falken® WILDPEAK® All-Terrain Tires and 8.1-inch ground clearance conquer trails in Griffith Park or the San Gabriel Mountains. Vibrant colors like Red Hot or Diamond Black Crystal Pearl fit LA’s trendsetting vibe, whether parked at a Venice Beach café or a Hollywood event.
Where to Find Deals in Los Angeles
| Dealership | Address | Distance from LA | Contact | Notes |
|---|---|---|---|---|
| Los Angeles CDJR | 2025 S Figueroa St, LA, CA 90007 | 0 miles | (213) 477-1800 | Wide inventory, $115 admin fee. |
| Van Nuys CDJR | 6110 Van Nuys Blvd, Van Nuys, CA 91401 | 9 miles | (818) 646-6700 | Offers like $2,928 down for Latitude. |
| Glendale Dodge Chrysler Jeep Ram | 900 S Brand Blvd, Glendale, CA 91204 | 9 miles | (818) 242-4161 | Low-mileage deals (5,000 miles/year). |
| Scott Robinson CDJR | 20900 Hawthorne Blvd, Torrance, CA 90503 | 20 miles | (855) 239-7629 | Monthly Compass specials. |
Visit Jeep’s website or Edmunds for real-time offers.
Final Thoughts
Leasing a 2025 Jeep Compass in Los Angeles is a savvy way to drive a versatile, stylish SUV that matches the city’s dynamic lifestyle. With monthly payments starting at ~$405–$507, incentives like Jeep Wave®, and trims from Sport to Trailhawk, the Compass offers value and flexibility. Whether navigating Hollywood traffic or exploring trails near Malibu, it delivers performance and style. Compare offers from LA-area dealers, negotiate terms, and leverage incentives to secure the best deal. Hit the road, LA!
2025 Jeep Compass Lease Guide for Simi Valley
Los Angeles, a city defined by its sprawling freeways, scenic coastal drives, and nearby rugged terrains like the Angeles National Forest or Joshua Tree, demands a vehicle that seamlessly blendsurban practicality with off-road capability. The 2025 Jeep Compass, a compact SUV with modern styling and Jeep’s legendary 4×4 heritage, is an excellent choice for Angelenos. Leasing the Compass allows you to enjoy its versatility and tech-forward features without the long-term commitment of ownership. This guide details the latest 2025 Jeep Compass lease deals in Los Angeles, why it’s a great fit for the city, and tips for securing the best deal, tailored to the 950-word requirement.
Why Lease a 2025 Jeep Compass in Los Angeles?
The 2025 Jeep Compass is designed for LA’s diverse lifestyle. Its compact size makes it easy to navigate tight parking spots in Santa Monica or Downtown LA, while its available 4×4 system and Trailhawk trim offer the capability to tackle off-road adventures in Malibu Creek State Park or Big Bear. Powered by a 2.0L turbo engine delivering 200 horsepower—best-in-class standard power—the Compass provides ample performance for merging onto the 405 or cruising along the Pacific Coast Highway. The Uconnect 5 infotainment system, featuring a 10.1-inch touchscreen, wireless Apple CarPlay, and advanced safety features like blind-spot monitoring and cross-traffic detection, caters to LA’s tech-savvy and safety-conscious drivers.
Leasing is a popular option in Los Angeles, where residents appreciate the flexibility of driving a new vehicle every few years, lower monthly payments compared to financing, and access to the latest technology. With competitive lease deals and high residual values, the 2025 Jeep Compass is an affordable way to drive a stylish, capable SUV that matches LA’s vibrant and adventurous spirit.
Current Lease Deals for the 2025 Jeep Compass in Los Angeles
Lease deals for the 2025 Jeep Compass in Los Angeles vary based on trim, mileage allowance, down payment, and credit score. Below are estimated offers based on recent data, valid through April 30, 2025, unless otherwise noted. Prices exclude California sales tax (8.5–10.25% in LA County), registration, and dealer fees (e.g., $115–$699), which can increase costs. Always confirm with dealers, as inventory and regional incentives vary.
- Jeep Compass Sport SUV:
- Monthly Payment: ~$426/month
- Down Payment: ~$1,000
- Term: 36 months
- Mileage: 10,000 miles/year
- Total Cost: ~$17,908 over the lease term
- Notes: The base Sport trim includes essentials like a 10.25-inch digital cluster and Uconnect 5, ideal for budget-conscious drivers seeking Jeep’s iconic style. Higher payments may apply for lower credit scores.
- Jeep Compass Latitude SUV:
- Monthly Payment: ~$405–$507/month
- Down Payment: ~$1,000–$2,953
- Term: 36 months
- Mileage: 10,000–12,000 miles/year
- Total Cost: ~$17,643–$18,802
- Notes: The Latitude trim adds premium features like adaptive cruise control and a larger touchscreen, popular for LA commuters. Van Nuys Chrysler Dodge Jeep Ram offers deals like $2,928 due at signing with a total cost of $17,908.
- Jeep Compass Limited SUV:
- Monthly Payment: ~$406/month
- Down Payment: ~$2,953
- Term: 36 months
- Mileage: 10,000 miles/year
- Total Cost: ~$18,802
- Notes: The Limited trim features leatherette seats and advanced safety tech, aligning with LA’s image-conscious culture.
- Regional Offer Example (Glendale, CA):
- Monthly Payment: ~$426/month
- Down Payment: ~$6,000 (includes first month’s payment, taxes, and fees)
- Term: 36 months
- Mileage: 5,000 miles/year
- Total Cost: Varies based on fees
- Notes: Offered by Glendale Dodge Chrysler Jeep Ram for well-qualified lessees (720+ credit). Excess mileage fees are $0.25/mile over 5,000/year.
- Special Offer Example:
- Monthly Payment: ~$259/month (Limited trim)
- Down Payment: Not specified, likely higher
- Term: Not specified, likely 36 months
- Mileage: Not specified
- Notes: Posted by a dealer outside LA (24 Auto Group), this deal may not be available locally but suggests potential for aggressive promotions. Verify similar offers at LA dealers.
These deals require Tier 1 credit (720+). Additional costs like taxes and documentation fees can add $243–$699, as noted at Los Angeles Chrysler Dodge Jeep Ram (2025 S Figueroa St.), which may include a negotiable $115 administration fee.
Incentives and Special Programs
Jeep offers several incentives to lower lease costs in Los Angeles:
- Jeep Wave® Program: Included with every 2025 Compass lease, it provides free maintenance (oil changes, tire rotations), ideal for LA’s traffic-heavy streets.
- Military Bonus Cash: Active, retired, or recently discharged veterans (within 12 months) can receive $500 off with an authorization number from Jeep’s verification service.
- First Responders Discount: A $500 bonus for law enforcement, firefighters, or medical personnel, supporting LA’s first responder community.
- FCA US LLC DriveAbility: Up to $1,000 reimbursement for adaptive equipment, aiding drivers with disabilities.
Some promotions, like 10% off MSRP or employee pricing, may exclude leases. Verify eligibility with dealers.
Tips for Leasing a Jeep Compass in Los Angeles
- Compare Dealerships: Explore offers from Los Angeles CDJR (2025 S Figueroa St.), Glendale Dodge Chrysler Jeep Ram, Scott Robinson Chrysler Dodge Jeep Ram in Torrance, or Sunnyvale CDJR. Each may have unique specials.
- Negotiate Terms: Haggle on capitalized cost, money factor, and mileage allowance. Increasing your down payment can lower monthly payments, but keep it under $3,000 for affordability.
- Account for Mileage: LA’s commutes (e.g., 101 or 405) can rack up miles. If you exceed 10,000–12,000 miles/year, negotiate a higher cap to avoid $0.25–$0.30/mile overage fees.
- Check Credit: Tier 1 credit (720+) unlocks the best rates. Lower scores may increase payments or down payments.
- Look Beyond LA: Dealerships in Van Nuys or Sunnyvale may offer better deals. For example, Sunnyvale CDJR has Compass specials.
- Understand Lease-End Options: Returning the vehicle incurs a $395 disposition fee unless you buy it or lease another Jeep. You can also purchase at the residual value (typically 50–60% of MSRP).
Why the Compass Suits LA’s Lifestyle
The 2025 Jeep Compass is tailored for Los Angeles’ blend of urban hustle and outdoor adventure. Its 24/32 city/highway MPG saves on fuel during commutes from the Valley to Downtown, while safety features like cross-traffic detection ease navigation on busy streets. The Trailhawk trim, with Falken® WILDPEAK® All-Terrain Tires, conquers trails in Griffith Park or the San Gabriel Mountains. Its vibrant color options and sleek design fit LA’s trendsetting vibe, whether parked at a Venice Beach café or a Hollywood hotspot.
Where to Find Deals in Los Angeles
Key dealerships to explore include:
- Los Angeles Chrysler Dodge Jeep Ram: 2025 S Figueroa St, Los Angeles, CA 90007. Call (213) 477-1800 for specials.
- Van Nuys Chrysler Dodge Jeep Ram: 9 miles from LA, offers deals like $2,928 due at signing for a Latitude.
- Glendale Dodge Chrysler Jeep Ram: 9 miles from LA, known for low-mileage lease deals.
- Scott Robinson Chrysler Dodge Jeep Ram: Torrance, CA, features monthly Compass specials.
For real-time offers, visit Jeep’s website or Edmunds.
Final Thoughts
Leasing a 2025 Jeep Compass in Los Angeles is a smart way to drive a versatile, stylish SUV that complements the city’s fast-paced, adventurous spirit. With monthly payments starting at ~$405–$426, incentives like Jeep Wave®, and trims from Sport to Limited, the Compass offers value and flexibility. Whether you’re navigating Santa Monica traffic or exploring trails near Malibu, this SUV delivers. Contact LA-area dealers, compare offers, and negotiate to secure the best lease deal for your needs. Drive on, LA!
Why Lease a 2025 Jeep Gladiator in Los Angeles?
The 2025 Jeep Gladiator combines the rugged DNA of the Jeep Wrangler with the practicality of a pickup truck. Its 5-foot bed, up to 7,700-pound towing capacity, and best-in-class 1,725-pound payload make it ideal for hauling gear to Malibu beaches or camping in Big Bear. The removable roof and doors deliver an open-air experience perfect for cruising along the Pacific Coast Highway, while the Uconnect 5 system with a 12.3-inch touchscreen—the largest in its class—keeps you connected in LA’s tech-savvy culture. With a 3.6L V6 engine (285 hp) and standard 4×4, the Gladiator tackles both Hollywood’s gridlock and off-road trails with ease.
Leasing is a popular choice in Los Angeles, where drivers value flexibility, lower monthly payments, and the ability to upgrade to a new vehicle every few years. With competitive lease offers and high residual values, the Gladiator can be an affordable way to drive a versatile truck that matches LA’s adventurous spirit.
Current Lease Deals for the 2025 Jeep Gladiator in Los Angeles
Lease deals for the 2025 Jeep Gladiator in Los Angeles vary by trim, mileage, down payment, and credit score. Below are estimated offers based on recent data, valid through April 30, 2025, unless otherwise noted. Prices exclude California sales tax (8.5–10.25% in LA County), registration, and dealer fees ($115–$699), which can increase costs. Contact dealers for exact terms, as inventory and incentives vary.
- Jeep Gladiator Sport 4×4:
- Monthly Payment: ~$483–$583/month
- Down Payment: ~$483–$3,235
- Term: 36–39 months
- Mileage: 10,000–12,000 miles/year
- Total Cost: ~$19,305–$28,961
- Notes: The base Sport trim offers essentials like a soft top and Uconnect 5. A deal in Alhambra, CA, lists $2,964 due at signing with a total cost of $19,206 over 36 months.
- Jeep Gladiator Nighthawk 4×4:
- Monthly Payment: ~$464–$583/month
- Down Payment: ~$2,964–$3,076
- Term: 36 months
- Mileage: 10,000 miles/year
- Total Cost: ~$19,206–$23,231
- Notes: The cheapest trim to lease in LA, with deals starting at $464/month. Available at Van Nuys Chrysler Dodge Jeep Ram with $2,967 due at signing.
- Jeep Gladiator Sport S 4×4:
- Monthly Payment: ~$505–$614/month
- Down Payment: ~$1,000–$3,000
- Term: 36 months
- Mileage: 10,000–12,000 miles/year
- Total Cost: ~$19,305–$23,746
- Notes: Adds features like power windows and alloy wheels. A post from Stateline CDJR mentions $350/month, but this may require specific terms or higher down payments.
- Jeep Gladiator Mojave/Rubicon 4×4:
- Monthly Payment: ~$641–$879/month
- Down Payment: ~$3,220
- Term: 36 months
- Mileage: 10,000 miles/year
- Total Cost: ~$28,413
- Notes: Premium trims with off-road enhancements like 33-inch all-terrain tires. Higher payments reflect added features.
- Regional Offer Example (Van Nuys, CA):
- Monthly Payment: ~$464/month (Nighthawk)
- Down Payment: ~$2,967
- Term: 36 months
- Mileage: 10,000 miles/year
- Total Cost: ~$19,305
- Notes: Offered by Van Nuys Chrysler Dodge Jeep Ram, 11 miles from LA. Requires Tier 1 credit (720+). Excess mileage fees are $0.25/mile.
Incentives and Special Programs
Jeep offers incentives to reduce lease costs in Los Angeles:
- Jeep Wave® Program: Included with every 2025 Gladiator lease, it provides free maintenance (oil changes, tire rotations) for worry-free driving in LA’s traffic.
- Military Bonus Cash: Active, retired, or recently discharged veterans (within 12 months) can get $500 off with an authorization number from Jeep’s verification service.
- First Responders Discount: A $500 discount for law enforcement, firefighters, or medical personnel, ideal for LA’s first responder community.
- FCA US LLC DriveAbility: Up to $1,000 reimbursement for adaptive equipment, supporting drivers with disabilities.
Some incentives, like Chrysler Capital Bonus Cash, may not apply to leases. Verify with dealers.
Tips for Leasing a Jeep Gladiator in Los Angeles
- Compare Dealerships: Check offers from Los Angeles CDJR (2025 S Figueroa St.), Van Nuys Chrysler Dodge Jeep Ram, Glendale Dodge Chrysler Jeep Ram, or Sunnyvale CDJR. Each may have unique specials.
- Negotiate Terms: Haggle on capitalized cost, money factor, and mileage. Increasing your down payment can lower monthly costs, but keep it under $3,000 for affordability.
- Consider Mileage: LA commutes (e.g., 405 or 101) can add miles quickly. If you exceed 10,000–12,000 miles/year, negotiate a higher cap to avoid $0.25–$0.30/mile overage fees.
- Check Credit: Tier 1 credit (720+) secures the best rates. Lower scores may increase payments or down payments.
- Look Beyond LA: Dealerships in Torrance or Sunnyvale may offer better deals. For example, Sunnyvale CDJR has Gladiator specials.
- Understand Lease-End Options: Returning the vehicle incurs a $395 disposition fee unless you buy it or lease another Jeep. You can also purchase at the residual value (61% after 5 years).
Why the Gladiator Fits LA’s Lifestyle
The 2025 Jeep Gladiator is built for Los Angeles’ mix of urban energy and outdoor exploration. Its 19 MPG combined fuel economy balances daily commutes from the Valley to Downtown, while safety features like adaptive cruise control ease navigation on crowded freeways. The Mojave and Rubicon trims, with enhanced suspension and all-terrain tires, conquer trails in Griffith Park or the San Gabriel Mountains. Its bold styling and vibrant colors like Joose or Mojito (California-exclusive) match LA’s trendsetting vibe, whether parked at Venice Beach or a Hollywood event.
Where to Find Deals in Los Angeles
Key dealerships to explore include:
- Los Angeles Chrysler Dodge Jeep Ram: 2025 S Figueroa St, Los Angeles, CA 90007. Call (213) 477-1800 for specials.
- Van Nuys Chrysler Dodge Jeep Ram: 11 miles from LA, offers deals like $464/month for a Nighthawk.
- Glendale Dodge Chrysler Jeep Ram: 9 miles from LA, known for competitive leases.
- Sunnyvale CDJR: Offers Gladiator specials, worth checking for LA residents willing to travel.
Visit Jeep’s website or Edmunds for real-time offers.
Final Thoughts
Leasing a 2025 Jeep Gladiator in Los Angeles is a smart way to drive a rugged, versatile truck that complements the city’s fast-paced, adventurous spirit. With monthly payments starting at ~$464–$583, incentives like Jeep Wave®, and trims from Sport to Rubicon, the Gladiator offers value and flexibility. Whether you’re hauling gear to Santa Monica or exploring trails near Malibu, this truck delivers. Contact LA-area dealers, compare offers, and negotiate to secure the best lease deal. Drive on, LA!
Jeep Compass Lease For Sale : Los Angeles
Los Angeles is a city of contrasts—sprawling freeways, sun-soaked coastal drives, and rugged trails just a short trip away in places like Angeles National Forest or Joshua Tree. The 2025 Jeep Compass, a compact SUV with urban sophistication and off-road grit, is an ideal match for LA’s dynamic lifestyle. Leasing this versatile vehicle allows Angelenos to enjoy its modern tech, bold style, and capability without the long-term commitment of ownership. This guide explores the latest 2025 Jeep Compass lease deals in Los Angeles, why it’s a great fit for the city, and tips to secure the best offer.
Why Lease a 2025 Jeep Compass in Los Angeles?
The 2025 Jeep Compass strikes a balance between city-friendly maneuverability and adventure-ready performance. Its compact footprint makes parking in tight spots—like those in West Hollywood or Downtown LA—a breeze, while its available 4×4 system and Trailhawk trim handle off-road escapes to Big Bear or Malibu Creek State Park with ease. Powered by a 2.0L turbo engine delivering 200 horsepower (best-in-class standard power), the Compass offers peppy performance for merging onto the 405 or cruising the Pacific Coast Highway. Inside, the Uconnect 5 infotainment system with a 10.1-inch touchscreen, wireless Apple CarPlay, and advanced safety features like blind-spot monitoring cater to LA’s tech-savvy and safety-conscious drivers.
Leasing is a popular choice in Los Angeles, where residents value flexibility and the chance to drive a new vehicle every few years. With competitive lease offers and incentives, the 2025 Jeep Compass can be an affordable way to enjoy a stylish SUV that fits both LA’s urban sprawl and outdoor adventures.
Current Lease Deals for the 2025 Jeep Compass in Los Angeles
Lease deals for the 2025 Jeep Compass vary by trim, mileage allowance, down payment, and credit score. Below are some of the latest offers available in the Los Angeles area, valid through April 30, 2025, unless otherwise noted. Prices are estimates based on recent data, but local taxes, registration, and dealer fees (e.g., $115–$699) can increase costs. Always contact dealers directly for precise terms.
- Jeep Compass Sport SUV:
- Monthly Payment: ~$426/month
- Down Payment: ~$1,000
- Term: 36 months
- Mileage: 10,000 miles/year
- Total Cost: ~$17,908 over the lease term
- Notes: The base Sport trim offers essentials like a 10.25-inch digital cluster and Uconnect 5, ideal for budget-conscious drivers who want Jeep’s iconic style. Higher payments may apply for lower credit scores.
- Jeep Compass Latitude SUV:
- Monthly Payment: ~$405–$507/month
- Down Payment: ~$1,000–$2,953
- Term: 36 months
- Mileage: 10,000–12,000 miles/year
- Total Cost: ~$17,643–$18,802
- Notes: The Latitude adds premium touches like adaptive cruise control and a larger touchscreen, making it a favorite for LA commuters. Check with dealers like Van Nuys Chrysler Dodge Jeep Ram for specific promotions.
- Jeep Compass Limited SUV:
- Monthly Payment: ~$406/month
- Down Payment: ~$2,953
- Term: 36 months
- Mileage: 10,000 miles/year
- Total Cost: ~$18,802
- Notes: The Limited trim includes leatherette seats and advanced safety tech, perfect for LA’s image-driven culture.
- Regional Offer Example (Glendale, CA):
- Monthly Payment: ~$426/month
- Down Payment: ~$6,000 (includes first month’s payment, taxes, and fees)
- Term: 36 months
- Mileage: 5,000 miles/year
- Notes: Available at Glendale Dodge Chrysler Jeep Ram for well-qualified lessees (720+ credit score). Excess mileage fees are $0.25/mile.
These deals exclude additional costs like California sales tax (8.5–10.25% in LA County) and registration fees. For example, Los Angeles Chrysler Dodge Jeep Ram at 2025 S Figueroa St. may add a negotiable administration fee up to $115.
Incentives and Special Programs
Jeep offers several incentives to sweeten the deal for Los Angeles lessees:
- Jeep Wave® Program: Included with every 2025 Compass lease, this provides free maintenance (oil changes, tire rotations) for worry-free driving in LA’s traffic-heavy streets.
- Military Bonus Cash: Active, retired, or recently discharged veterans (within 12 months) can claim $500 off. Submit eligibility details online for an authorization number.
- First Responders Discount: A $500 bonus is available for law enforcement, firefighters, or medical personnel, a great perk for LA’s first responder community.
- FCA US LLC DriveAbility: Offers up to $1,000 reimbursement for adaptive equipment, supporting drivers with disabilities.
Note that some promotions, like employee pricing, may not apply to leases. Verify eligibility with your dealer.
Tips for Leasing a Jeep Compass in Los Angeles
- Shop Around: Compare offers from dealers like Los Angeles CDJR (2025 S Figueroa St.), Glendale Dodge Chrysler Jeep Ram, or Scott Robinson Chrysler Dodge Jeep Ram in Torrance. Each may have unique specials.
- Negotiate Key Terms: Haggle on the capitalized cost (vehicle price), money factor (interest rate), and mileage allowance. Increasing your down payment can lower monthly costs, but aim to keep it under $3,000 for affordability.
- Account for Mileage: LA’s commutes—think 101 to 110—can pile on miles. If you exceed 10,000–12,000 miles/year, negotiate a higher cap to avoid $0.25–$0.30/mile overage fees.
- Check Your Credit: Tier 1 credit (720+) unlocks the best rates. If your score is lower, expect higher payments or a larger down payment.
- Explore Nearby Dealerships: Dealers in Van Nuys, Santa Monica, or Sunnyvale may offer better deals. For example, Sunnyvale CDJR has competitive Compass specials.
- Understand Lease-End Costs: Returning the vehicle incurs a $395 disposition fee unless you buy it or lease another Jeep. You can also purchase the Compass at its residual value.
Why the Compass Suits LA’s Lifestyle
The 2025 Jeep Compass is built for Los Angeles’ blend of urban hustle and outdoor adventure. Its 24/32 city/highway MPG saves on fuel during long commutes from the Valley to Downtown, while safety features like cross-traffic detection ease navigation on crowded streets. The Trailhawk trim, with Falken® WILDPEAK® All-Terrain Tires, tackles trails in Griffith Park or the San Gabriel Mountains. With vibrant colors and sleek styling, the Compass fits LA’s trendsetting vibe, whether you’re parked at a Venice Beach café or a Hollywood hotspot.
Where to Find Deals in Los Angeles
Key dealerships to explore include:
- Los Angeles Chrysler Dodge Jeep Ram: 2025 S Figueroa St, Los Angeles, CA 90007. Call (213) 477-1800 for current specials.
- Glendale Dodge Chrysler Jeep Ram: 9 miles from LA, known for low-mileage lease deals.
- Scott Robinson Chrysler Dodge Jeep Ram: Torrance, CA, offers monthly Compass promotions.
- Van Nuys Chrysler Dodge Jeep Ram: 9 miles from LA, with deals like $2,928 due at signing for a Latitude.
For real-time offers, visit Jeep’s website or Edmunds.
Final Thoughts
Leasing a 2025 Jeep Compass in Los Angeles is a smart way to drive a versatile, stylish SUV that matches the city’s fast-paced, adventurous spirit. With monthly payments starting at ~$405–$426, incentives like Jeep Wave®, and a range of trims, the Compass is both affordable and practical. Whether you’re weaving through Santa Monica traffic or exploring trails near Malibu, this SUV delivers. Contact LA-area dealers, compare offers, and negotiate to land the best lease deal for your needs. Happy driving!
Bikini Pearl Jeep Wrangler For Sale

Few colors in the Jeep palette have made waves like Bikini Pearl. A vibrant, tropical-inspired teal with metallic flake, Bikini Pearl-Coat became an instant fan-favorite from the moment it appeared in Jeep’s lineup. Rugged yet radiant, this finish turns heads on highways and trailheads alike. Now that Jeep has limited its production, finding a Bikini Pearl Jeep Wrangler for sale feels like discovering treasure—especially in a sea of black, white, and gray SUVs.
If you’re searching for a Wrangler that makes a statement before it even moves, here’s everything you need to know about buying a Bikini Pearl Jeep, including availability, trims, key specs, and why Simi Valley Chrysler Dodge Jeep Ram is one of the best places to find one.
What is Bikini Pearl Coat?
Bikini Pearl Coat is a limited-edition Jeep color introduced on select models of the Jeep Wrangler and Jeep Renegade between 2019 and 2021. The shade is a blend of teal and turquoise, with just enough metallic sheen to shimmer under the sun without looking overdone.
Bikini Pearl Finish Breakdown
| Finish Type | Pearl-Coat (Metallic) |
|---|---|
| Color Family | Blue-Green |
| Best In | Sunlight and coastal climates |
| Availability | Rare, limited-production run |
| Paint Code | PZQ |
Which Wrangler Trims Were Offered in Bikini Pearl?
While Bikini Pearl was not available across all trims, it could be ordered on many mid-level and premium configurations of the Jeep Wrangler JL platform, both in two-door and four-door (Unlimited) formats.
Trim Availability by Year
| Model Year | Eligible Trims |
|---|---|
| 2019 | Sport S, Sahara, Rubicon |
| 2020 | Sport S, Sahara, Rubicon, Altitude |
| 2021 | Willys Sport, Islander, Rubicon |
| Discontinued | After early 2021 production |
Due to high demand and its short production cycle, Bikini Pearl Wranglers have become highly sought-after in the used and certified pre-owned market.
Bikini Pearl Jeep Wrangler Specs (2020 Rubicon Example)
Here’s a look at the mechanical specs you can expect if you’re eyeing a 2020 Jeep Wrangler Rubicon Bikini Pearl Edition:
| Category | Details |
|---|---|
| Engine | 3.6L Pentastar V6 with ESS |
| Horsepower | 285 hp @ 6,400 rpm |
| Torque | 260 lb-ft @ 4,800 rpm |
| Transmission | 6-speed manual or 8-speed automatic |
| Drivetrain | 4×4 (Command-Trac or Rock-Trac) |
| Tires | 33” All-Terrains |
| Towing Capacity | Up to 3,500 lbs |
| Interior | Cloth or leather, Uconnect 4 or 4C NAV |
While configurations vary slightly by year and trim, most Bikini Pearl Wranglers came with premium options, making them top-of-the-line models in both form and function.
Why Buy a Bikini Pearl Jeep Wrangler?
Aside from its unique aesthetics, Bikini Pearl Wranglers offer something even more valuable—exclusivity.
Key Advantages
- Rare Paint Code: Discontinued color means increasing collector appeal.
- Resale Value: Limited editions often hold value better.
- Perfect for SoCal Lifestyle: Tropical tones, off-road performance.
- Standout Factor: You won’t see another like it in every parking lot.
Whether you’re pulling up to Venice Beach or heading for a weekend in Big Bear, this color demands attention—and earns admiration.
Where to Find a Bikini Pearl Jeep Wrangler for Sale
Finding a Bikini Pearl Wrangler can be a challenge—many dealerships no longer have them in stock, and private sellers often hold onto them due to their rarity.
That said, Simi Valley Chrysler Dodge Jeep Ram maintains a robust certified pre-owned Jeep inventory, and has been known to carry Bikini Pearl Rubicons, Saharas, and Willys trims when available. They often feature:
- Low mileage units
- Clean Carfax history
- Fresh detail and mechanical inspection
- Available Jeep Wave membership perks
- Competitive pricing and trade-in bonuses
Financing a Bikini Pearl Jeep – What to Expect
Given that these vehicles are now available primarily through the pre-owned market, financing depends on model year, mileage, and condition.
Typical Financing Terms (Certified Pre-Owned)
| Model Year | Price Range (USD) | Monthly Payment (Est.) |
|---|---|---|
| 2019 Rubicon | $38,000 – $42,000 | $595 – $655/month (72 mo) |
| 2020 Sahara | $40,000 – $44,000 | $630 – $690/month (72 mo) |
| 2021 Willys Sport | $35,000 – $39,000 | $545 – $610/month (72 mo) |
Simi CDJR also offers 0% financing for select Jeep models, and $1,000 trade-in bonuses that can be applied toward pre-owned Wrangler purchases.
Final Thoughts: Bikini Pearl is More Than a Color—It’s a Statement
In a world full of copy-paste SUVs, the Bikini Pearl Jeep Wrangler is unapologetically bold. It blends Jeep’s heritage of trail-rated performance with the kind of aesthetic flair you rarely see outside of custom builds or concept vehicles.
If you’re the kind of driver who wants capability and character—who sees your vehicle as an extension of your personality—then this is the Wrangler to watch for.
And if you’re in California? Make Simi Valley CDJR your first stop. You may just find one of the last remaining Bikini Pearl Wranglers in showroom-ready condition.
Connect with us


